Graph and Spreadsheet results for mitochondrial fission 1 protein [Homo sapiens].: , gi: 5057152
Accession Number: NP_057152, GI Number: 5057152
Each point on the X axis represents the mean of scale value of each amino acid calculated in the window.
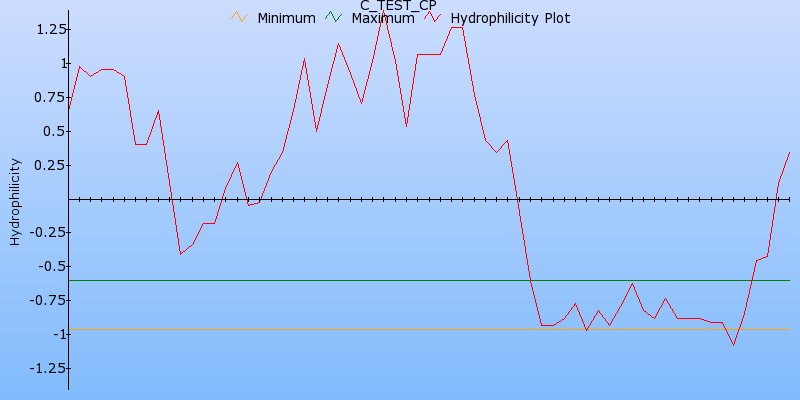 |
| Sequence: GNYRLKEYEKALKYVRGLLQTEPQNNQAKELERLIDKAMKKDGLVGMAIVGGMALGVAGLAGLIGLAVSKSKS |
| Window Size: 9 Threshold A: -0.960000 Threshold B: -0.600000 Scale Type: Hopp-Woods |
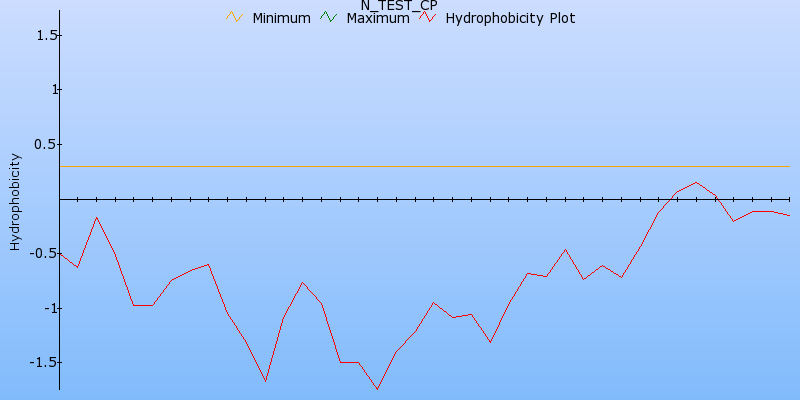 |
| Sequence: MEAVLNELVSVEDLLKFEKKFQSEKAAGSVSKSTQFEYAWCLVRSKYN |
| Window Size: 9 Threshold A: 0.300000 Threshold B: 0.000000 Scale Type: White |
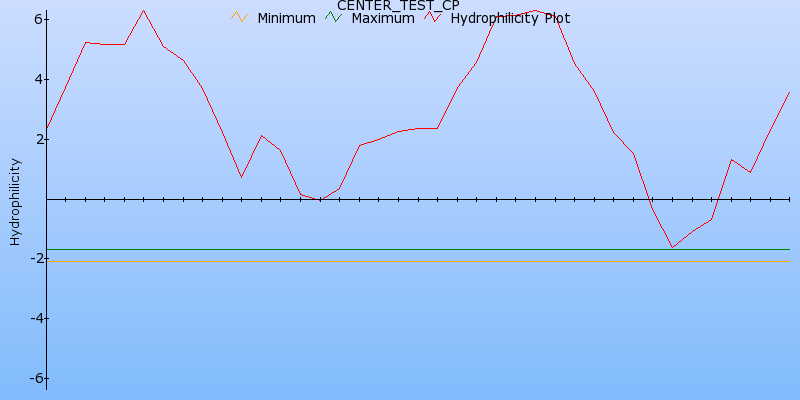 |
| Sequence: CLVRSKYNDDIRKGIVLLEELLPKGSKEEQRDYVFYLAVGNYRLKE |
| Window Size: 8 Threshold A: -2.100000 Threshold B: -1.700000 Scale Type: Engleman-Steitz |
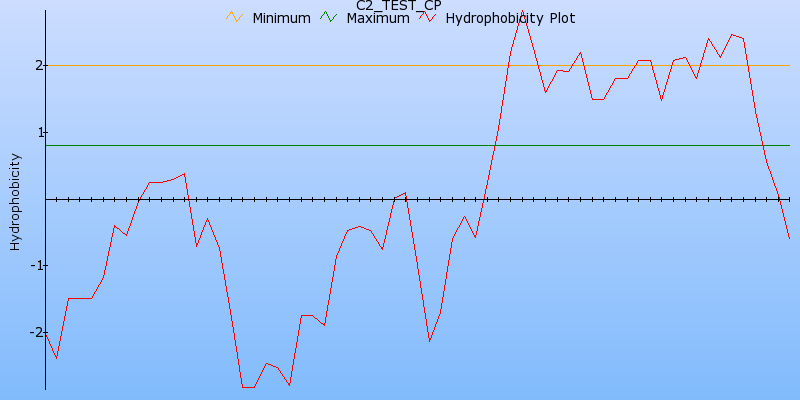 |
| Sequence: YRLKEYEKALKYVRGLLQTEPQNNQAKELERLIDKAMKKDGLVGMAIVGGMALGVAGLAGLIGLAVSKSKS |
| Window Size: 7 Threshold A: 2.000000 Threshold B: 0.800000 Scale Type: Kyte-Doolittle |