 |
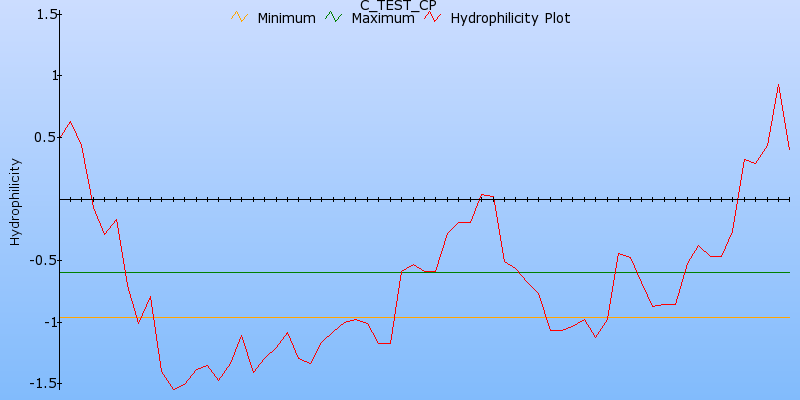
| Sequence: LGKQVRSLKALVITIFNFIVTVVAAFVCTYLGSQYIFTEMASRVLAALIVASVVGLAELYVMVRAMEGELGEL |
| Window Size: 9 Threshold A: -0.960000 Threshold B: -0.600000 Scale Type: Hopp-Woods |
Each point on the X axis represents the mean of scale value of each amino acid calculated in the window.
|
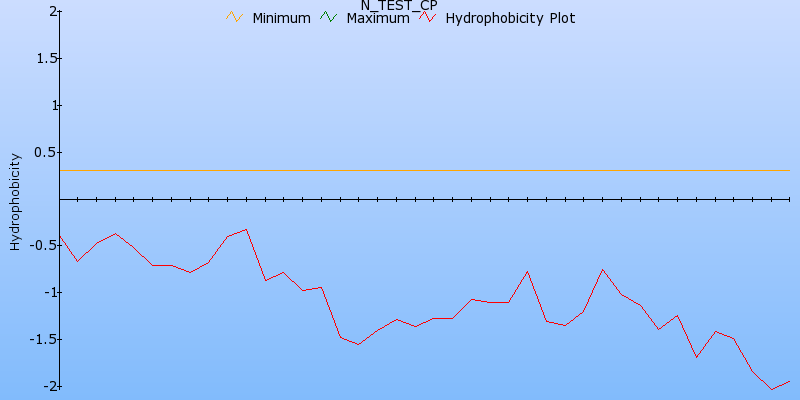
| Sequence: LGKQVRSLKALVITIFNFIVTVVAAFVCTYLGSQYIFTEMASRVLAALIVASVVGLAELYVMVRAMEGELGEL |
| Window Size: 9 Threshold A: -0.960000 Threshold B: -0.600000 Scale Type: Hopp-Woods |
 |
| Sequence: MASSLLAGERLVRALGPGGELEPERLPRKLRAELEAALGKKHKGGDSS |
| Window Size: 9 Threshold A: 0.300000 Threshold B: 0.000000 Scale Type: White |
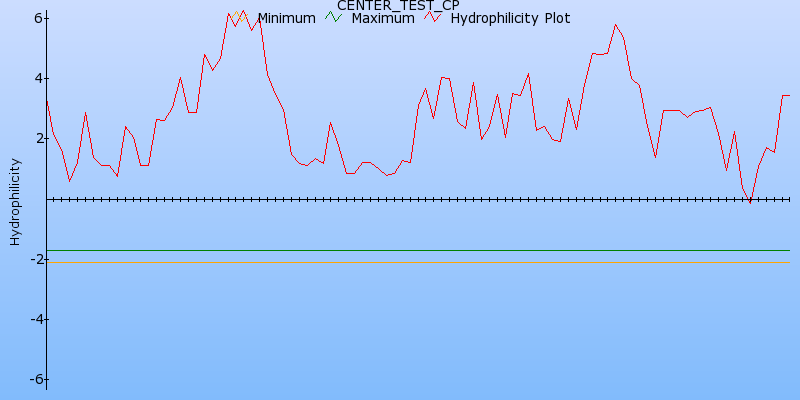 |
| Sequence: KHKGGDSSSGPQRLVSFRLIRDLHQHLRERDSKLYLHELLEGSEIYLPEVVKPPRNPELVARLEKIKIQLANEEYKRITR NVTCQDTRHGGTLSDLGKQVRS |
| Window Size: 8 Threshold A: -2.100000 Threshold B: -1.700000 Scale Type: Engleman-Steitz |
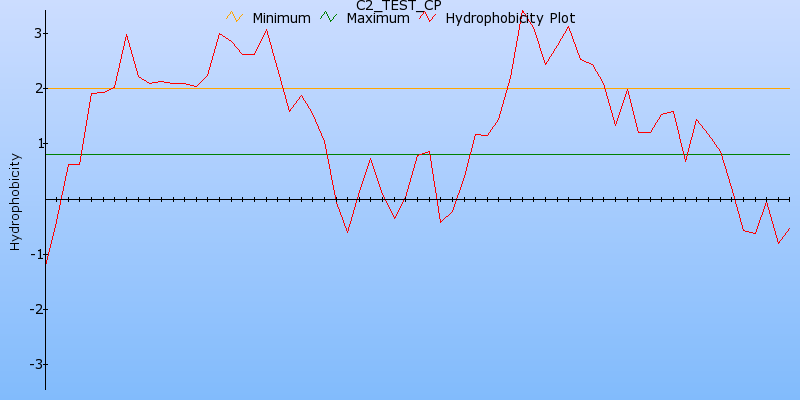 |
| Sequence: KQVRSLKALVITIFNFIVTVVAAFVCTYLGSQYIFTEMASRVLAALIVASVVGLAELYVMVRAMEGELGEL |
| Window Size: 7 Threshold A: 2.000000 Threshold B: 0.800000 Scale Type: Kyte-Doolittle |